
The National Picture: Prices Hit Their Highest Level in a Year
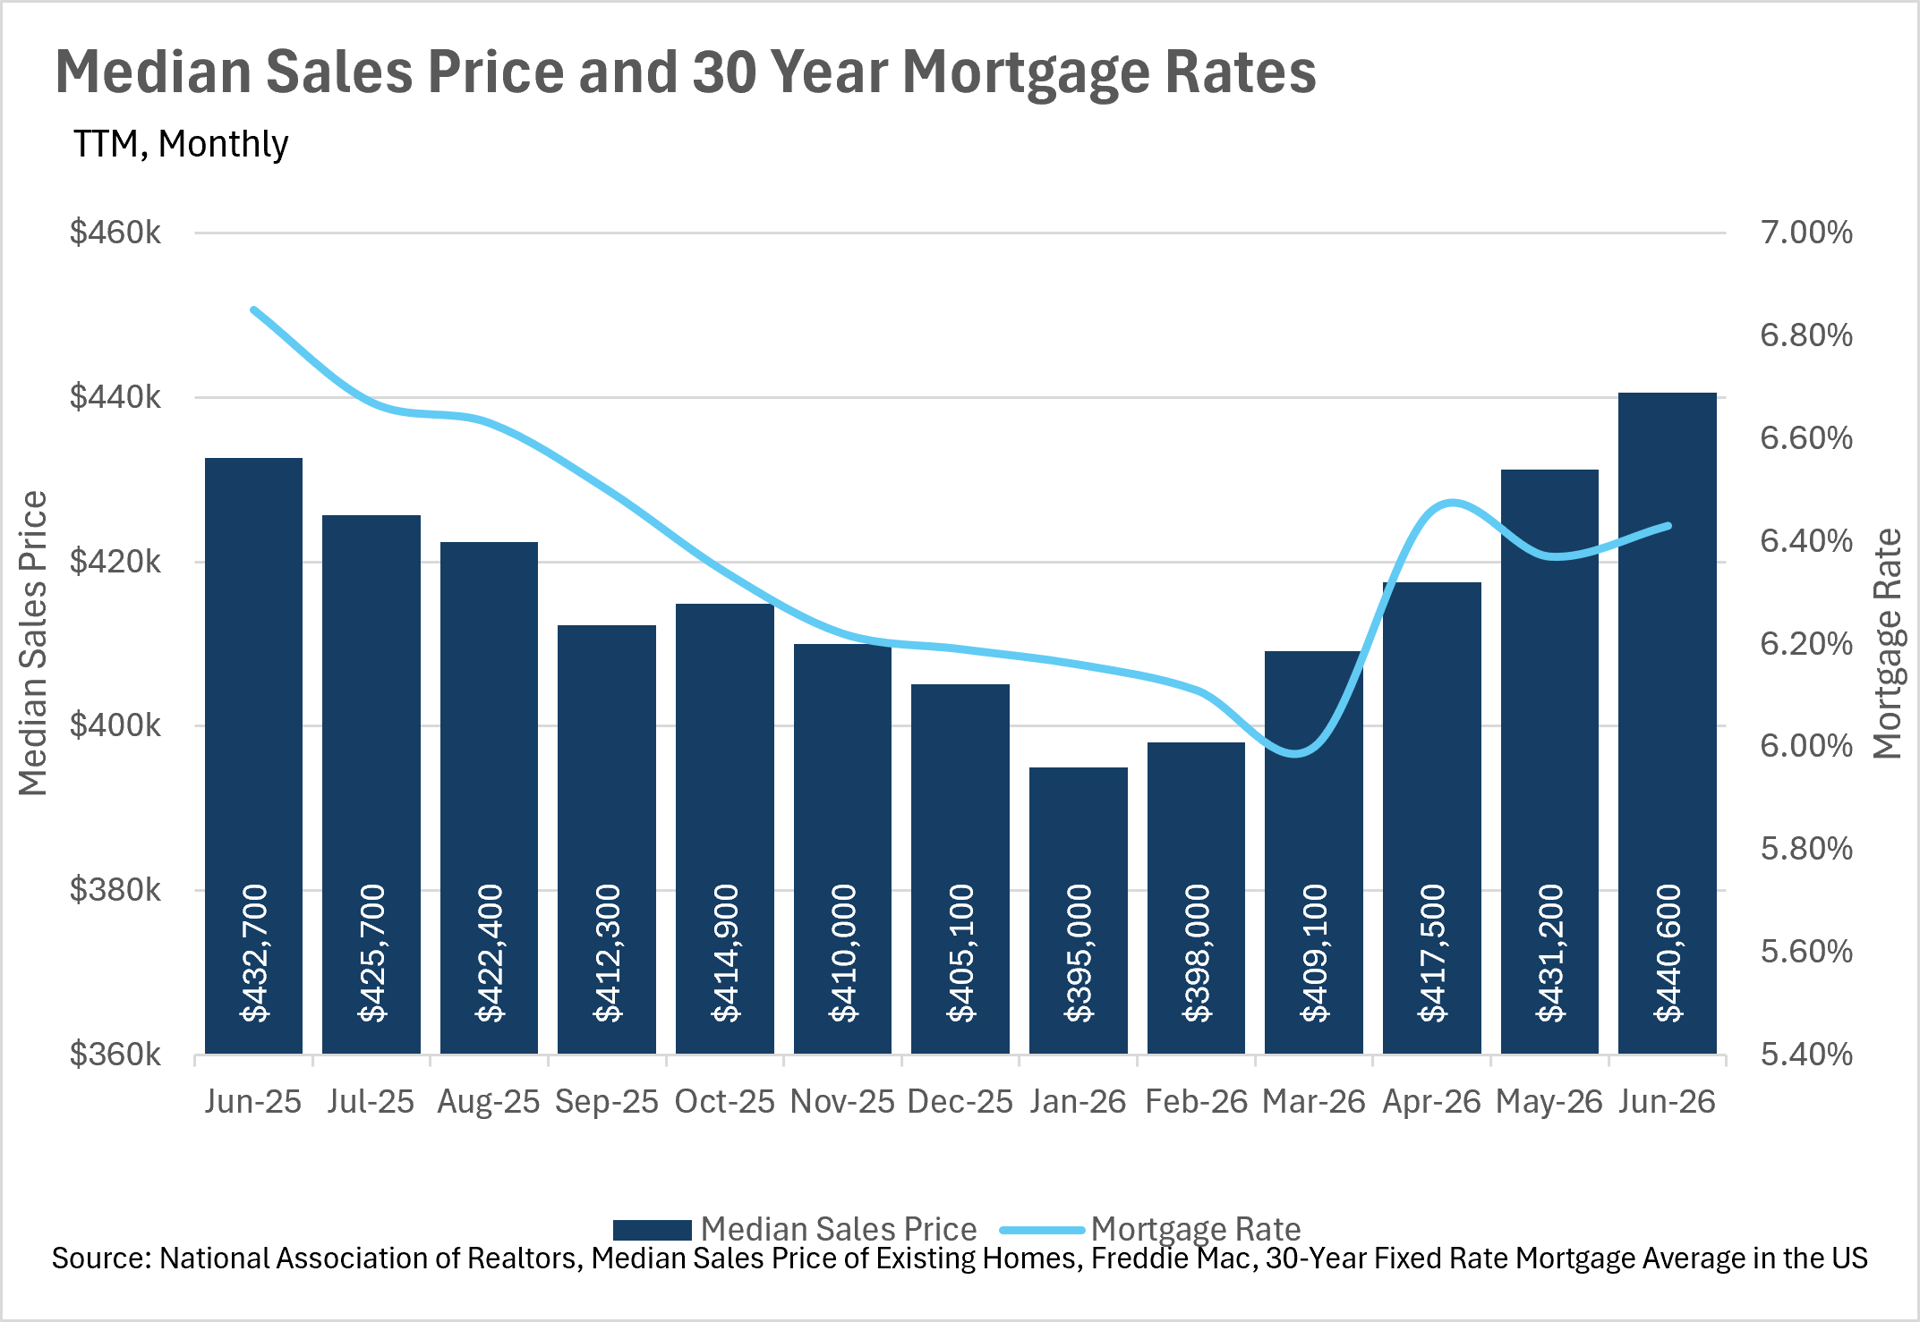
The spring rally that began in January has officially pushed median home sale prices to their highest point in twelve months. Nationally, the median home sold for $440,600 in June — a 1.83% year-over-year gain and the fifth consecutive month of month-over-month price increases.
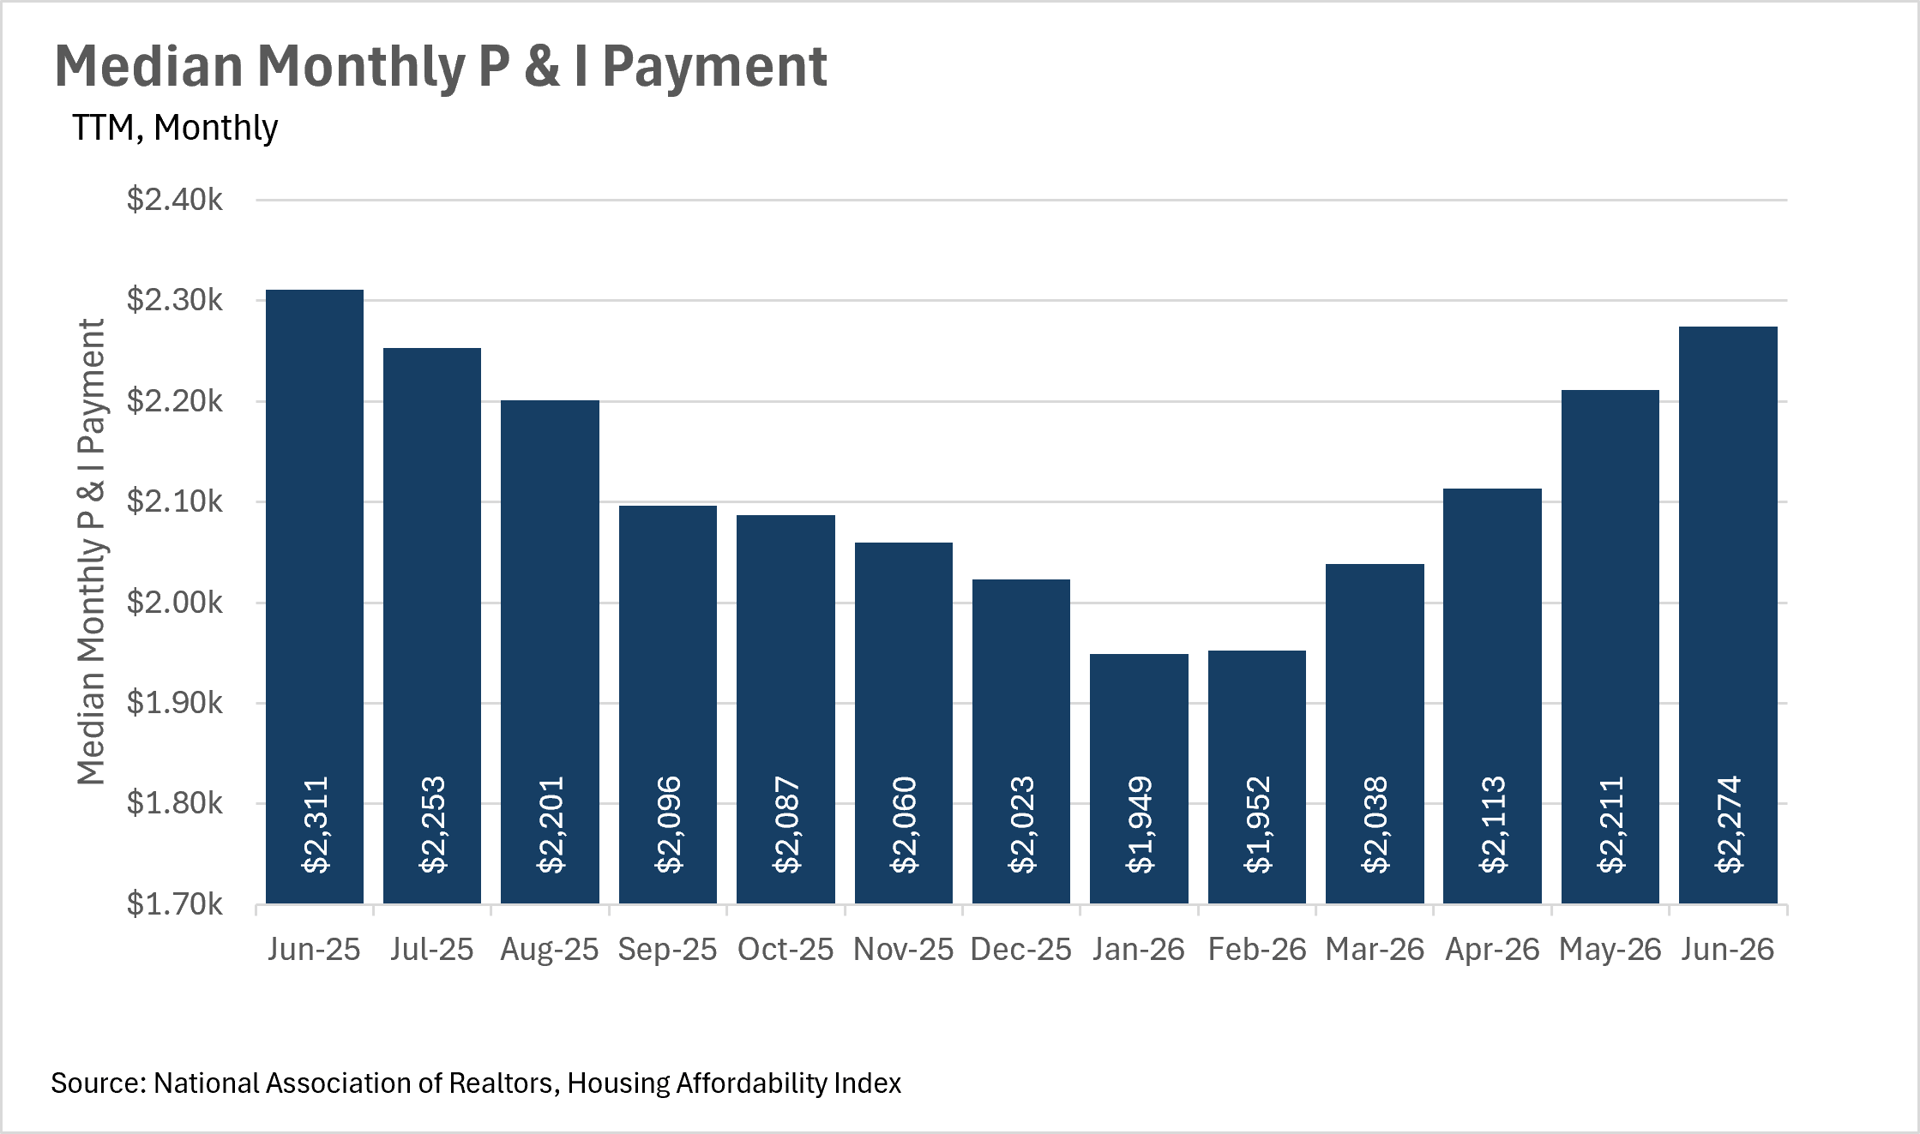
Mortgage rates ticked up slightly to 6.43% in June, and the combination of rising prices and rates that have bounced off their March lows has pushed the median monthly principal and interest payment to $2,274. That figure is still about 1.6% lower than it was a year ago, but the gap is narrowing. In January, the median monthly payment was $1,949. Five months later, it has risen by more than $300. If this trend continues through the summer, the affordability gains that lower rates provided earlier in the year may be fully erased.
Inventory Has Leveled Off — and That Matters
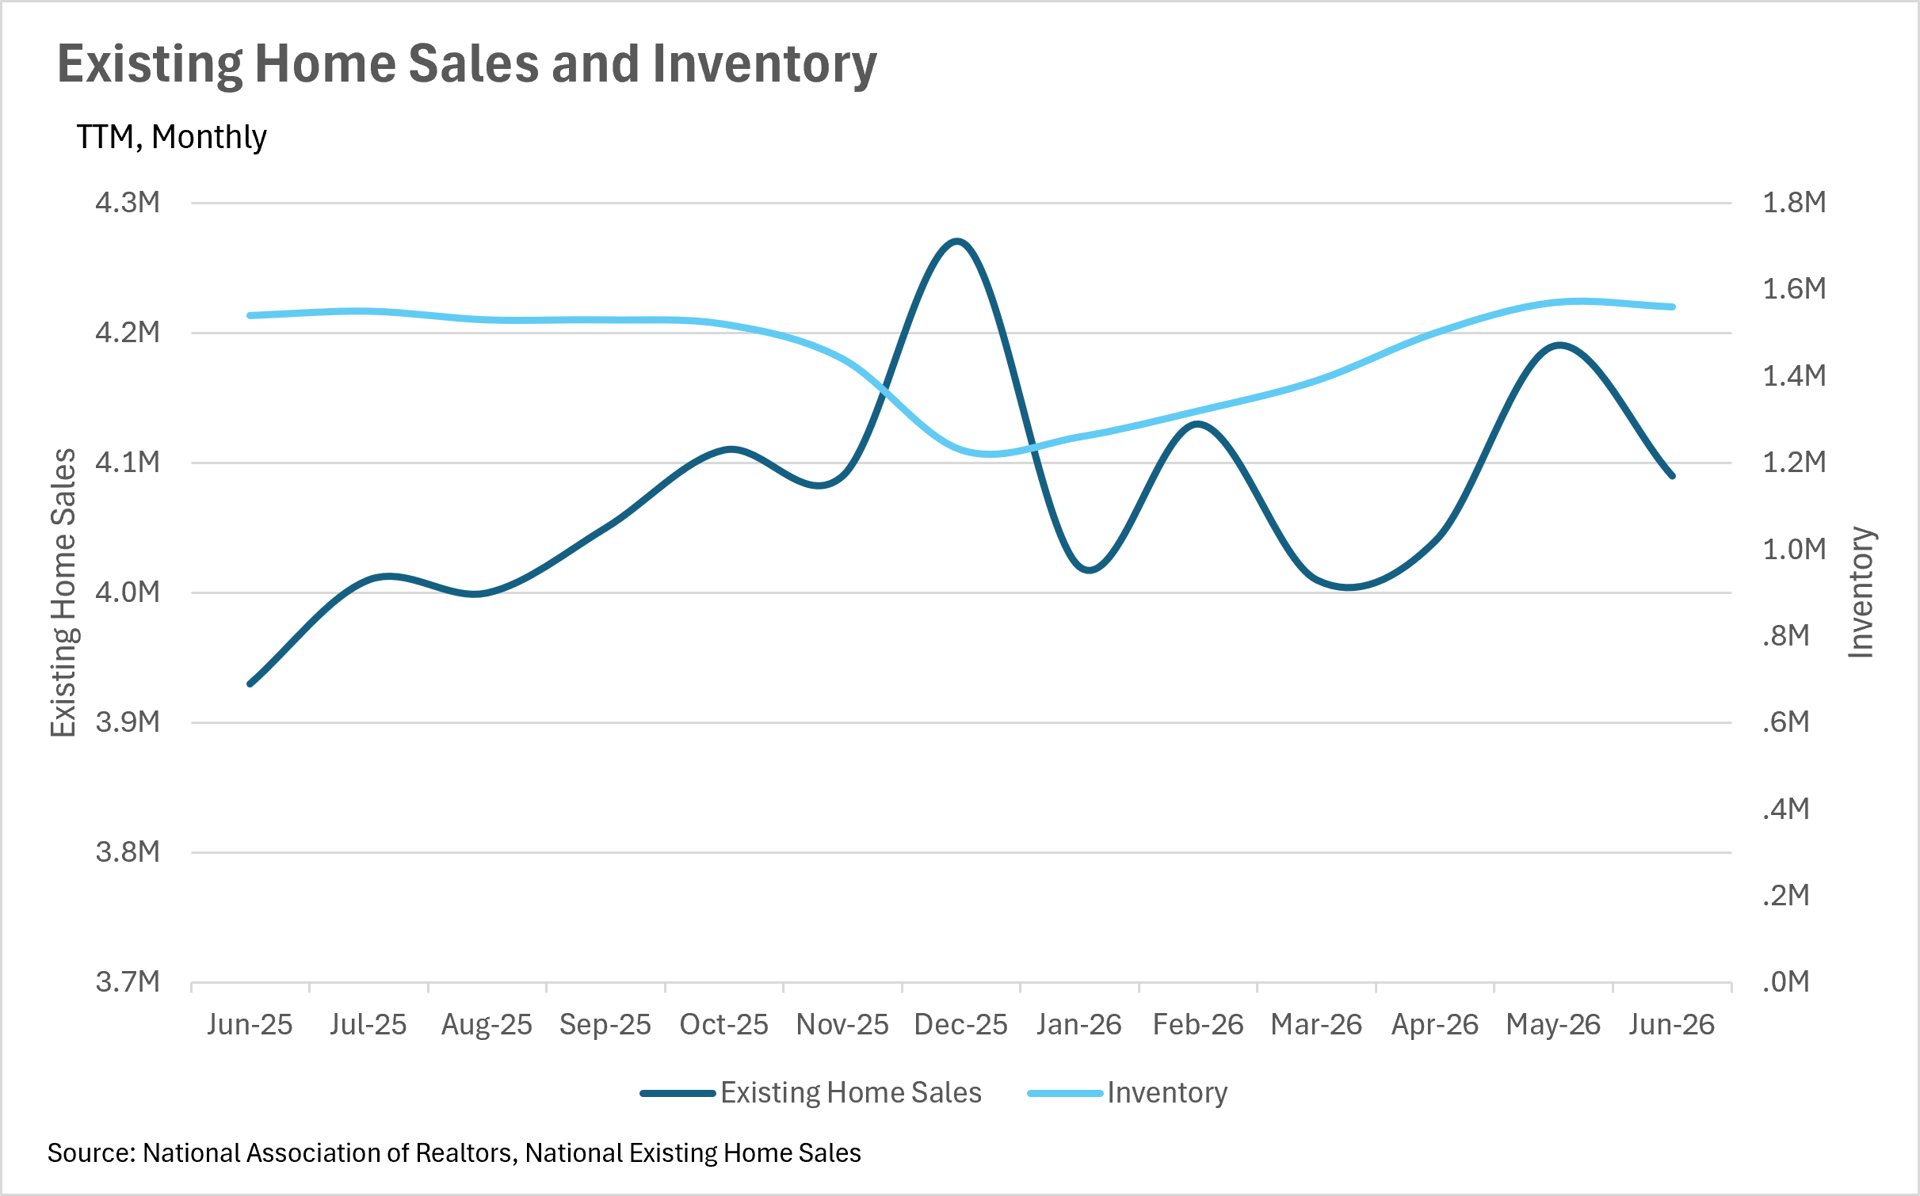
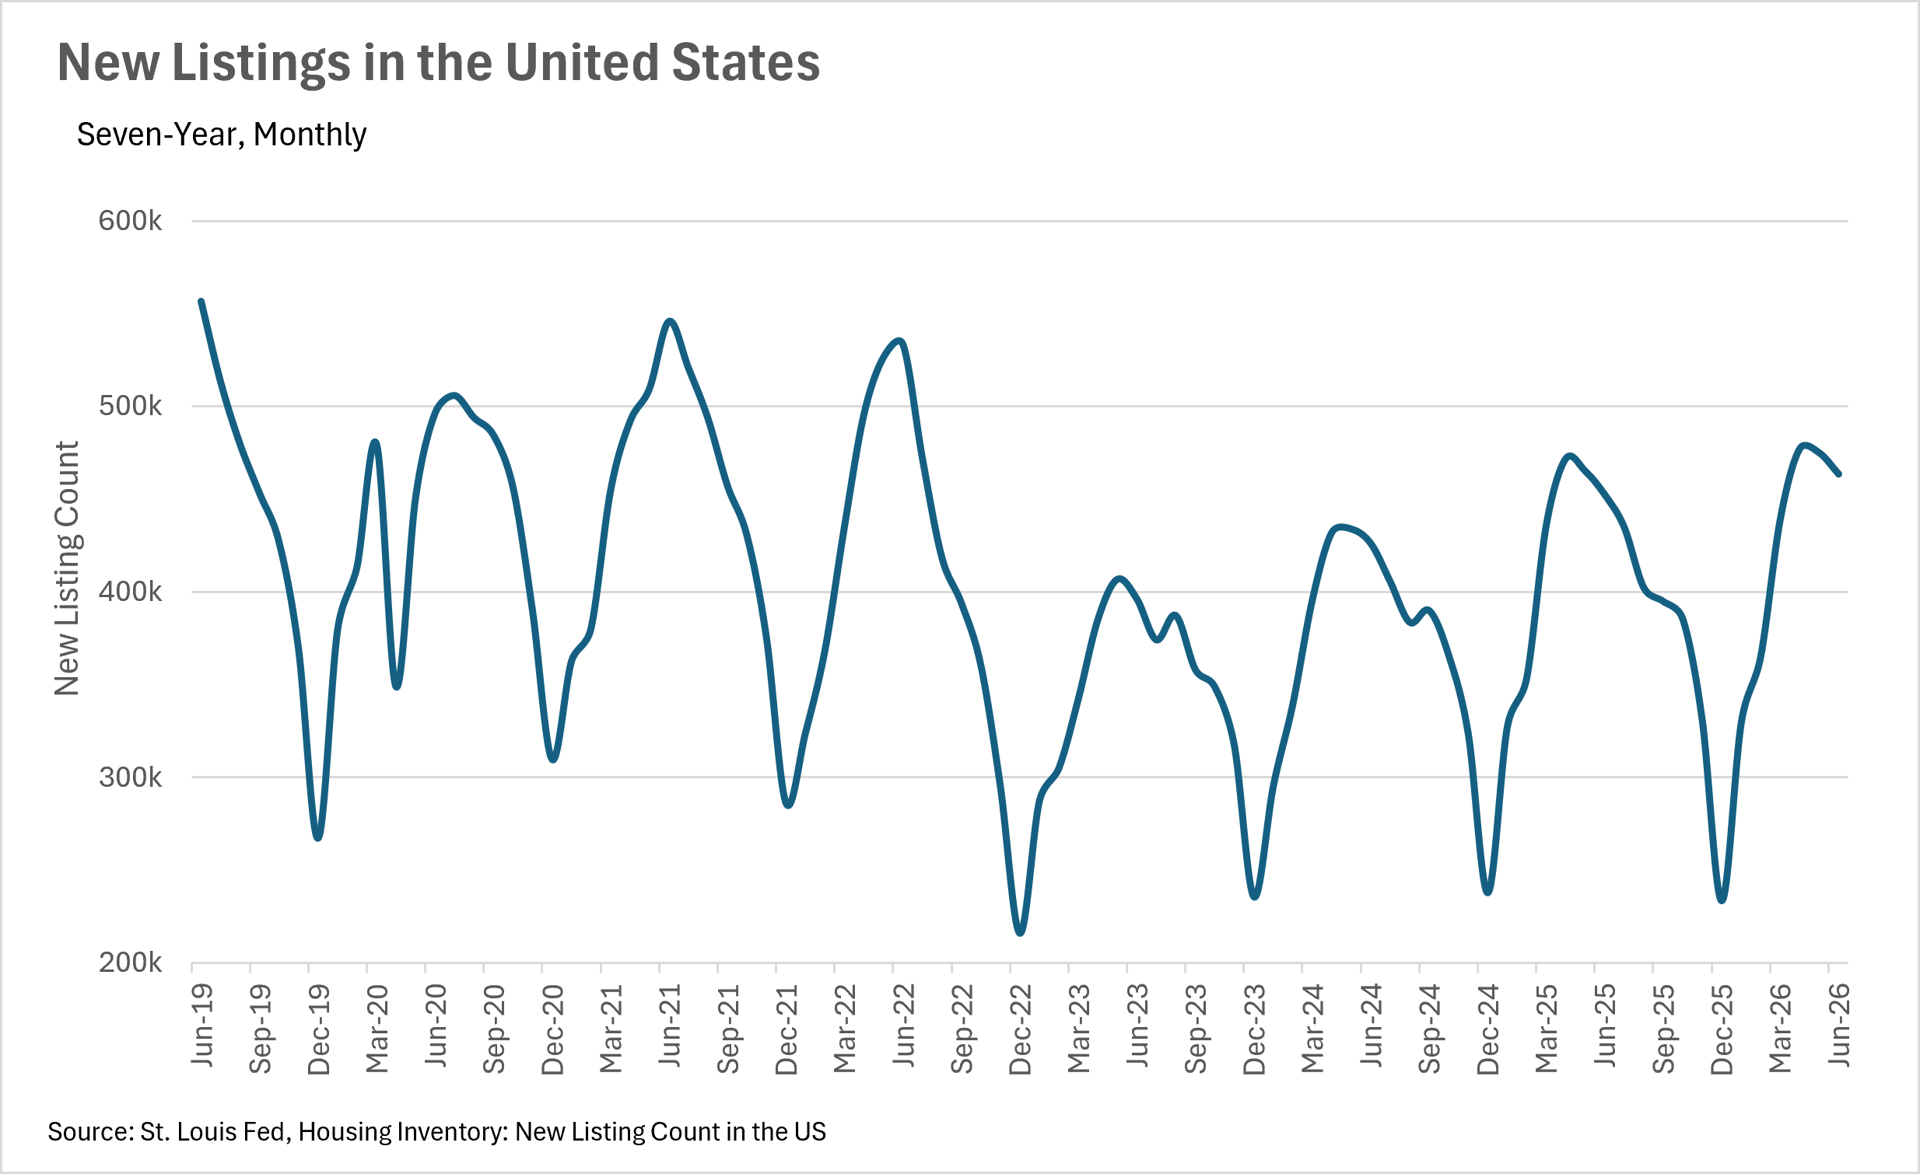
After climbing steadily from the December low of 1,230,000, national inventory appears to have plateaued. In June, there were 1,560,000 homes available for sale — a slight month-over-month decline from May, though still 1.3% higher than this time last year. New listings also pulled back slightly in June, which is notable given that June and July are typically peak months for supply.
If inventory continues to decline while demand stays strong, we could see the market tighten further heading into the second half of summer.
Existing Home Sales Are Up More Than 4% Year-Over-Year
Existing home sales came in at 4,090,000 in June, representing a 4.07% year-over-year increase — the strongest year-over-year gain in quite some time. Sales did pull back slightly from May's pace, which is consistent with typical seasonal patterns, but the year-over-year figure is the real headline. Buyers are meaningfully more active than they were at this point last year.
The combination of rates still lower than a year ago, more inventory to choose from, and steady price appreciation appears to be creating urgency among buyers who have been waiting on the sidelines.
The San Diego Story: Fast, Competitive, and Holding Firm Above $1M
Locally, the data tells a compelling story for anyone thinking about buying or selling in San Diego.
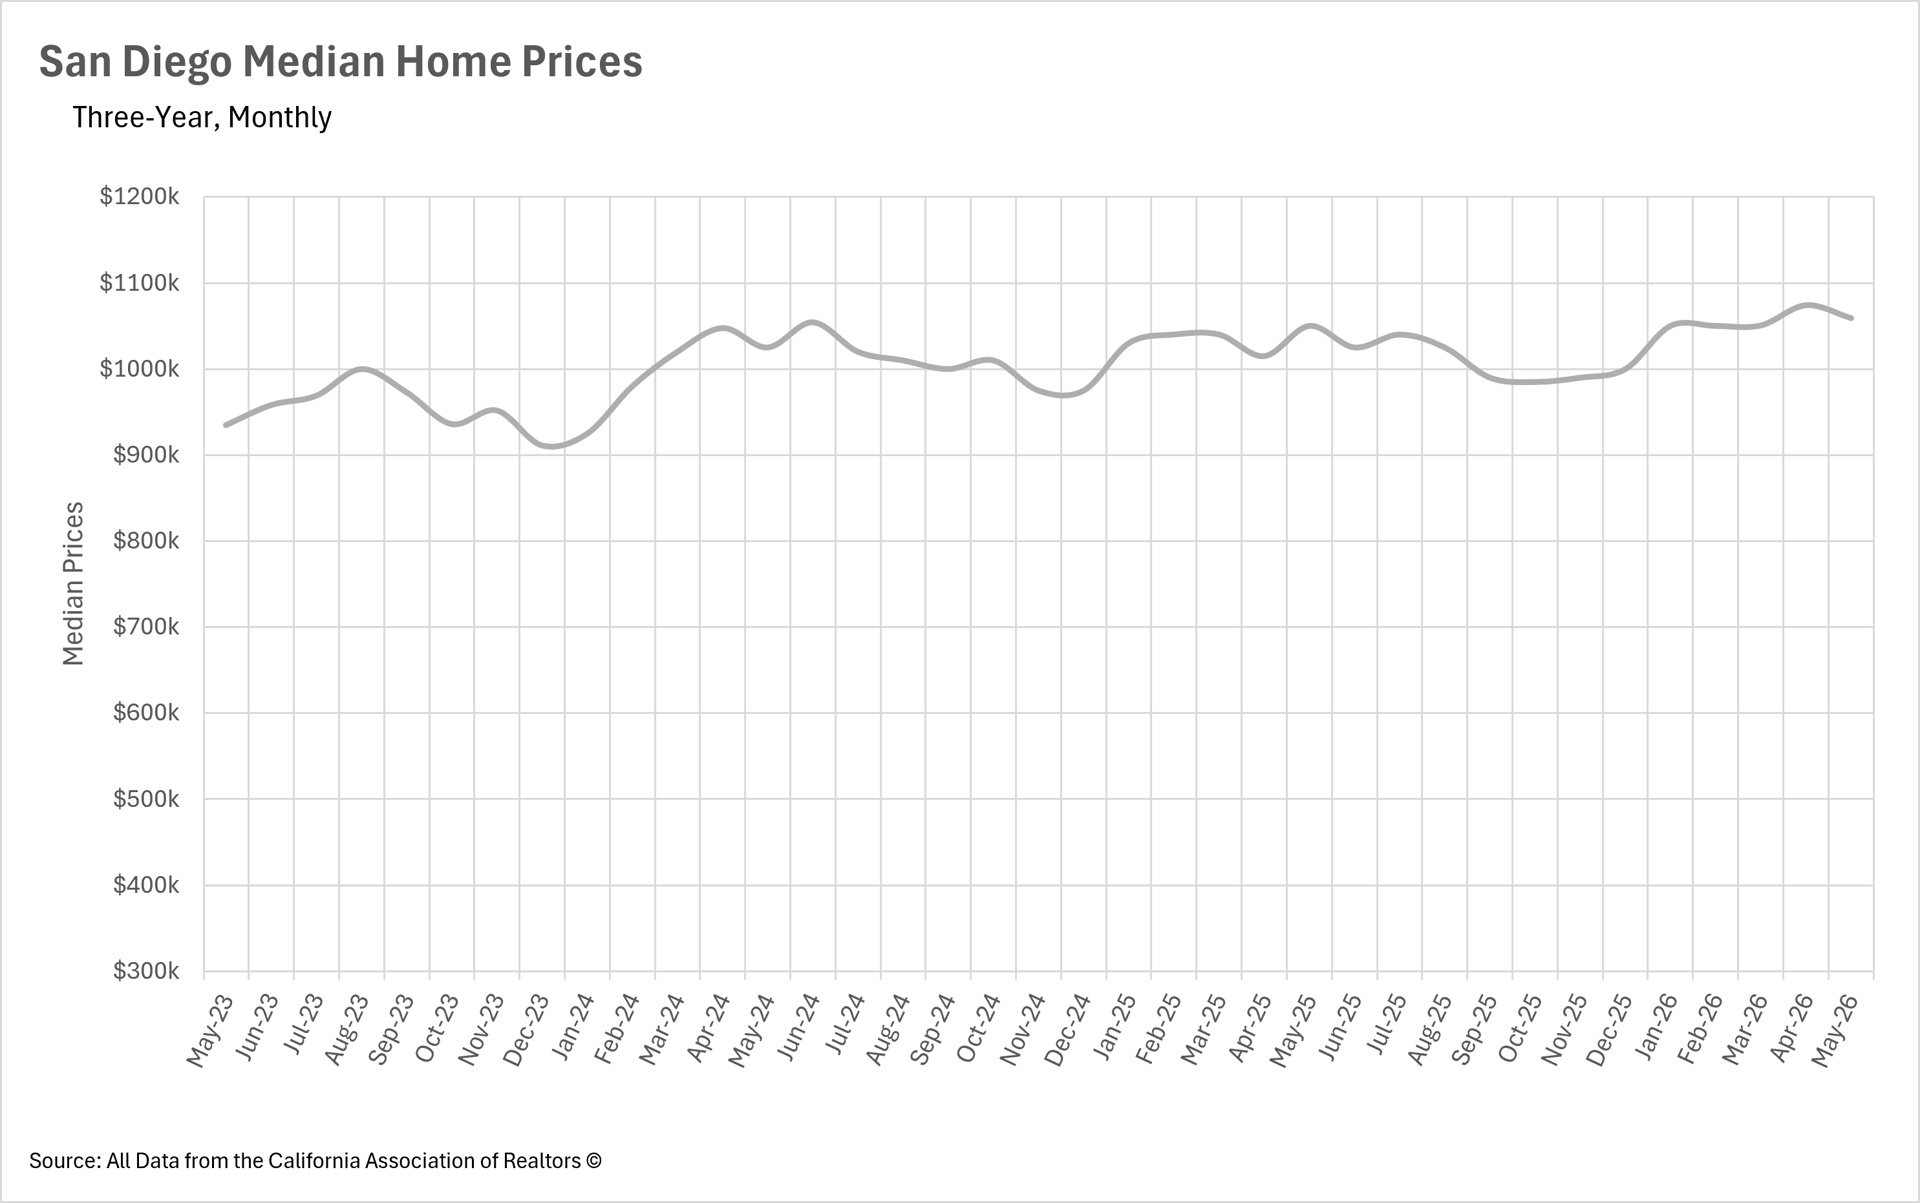
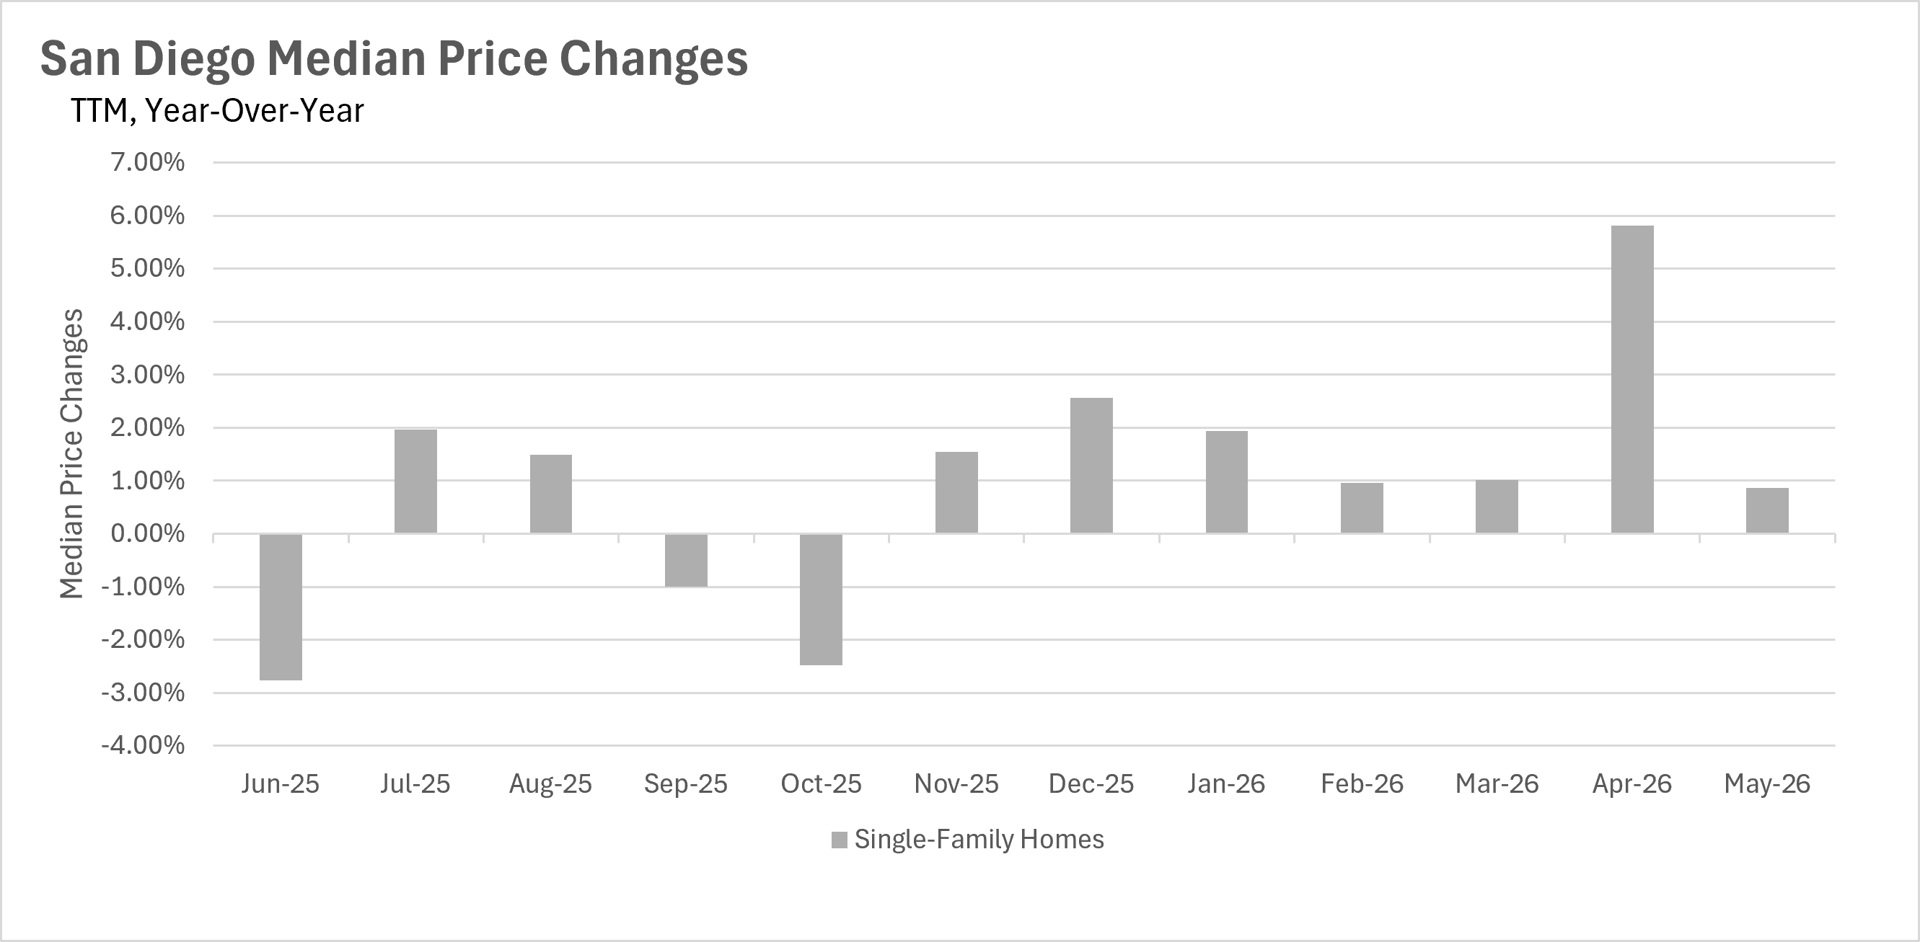
Prices remain above the million-dollar threshold. The median single-family home in San Diego sold for $1,059,000 in May — a modest 0.86% year-over-year gain. While that's a cooler increase than the 5.81% jump seen in April, context matters: May 2025 was one of the stronger months of the prior year, making it a tougher comparison to beat. More importantly, San Diego has now posted eight consecutive months of year-over-year price gains.
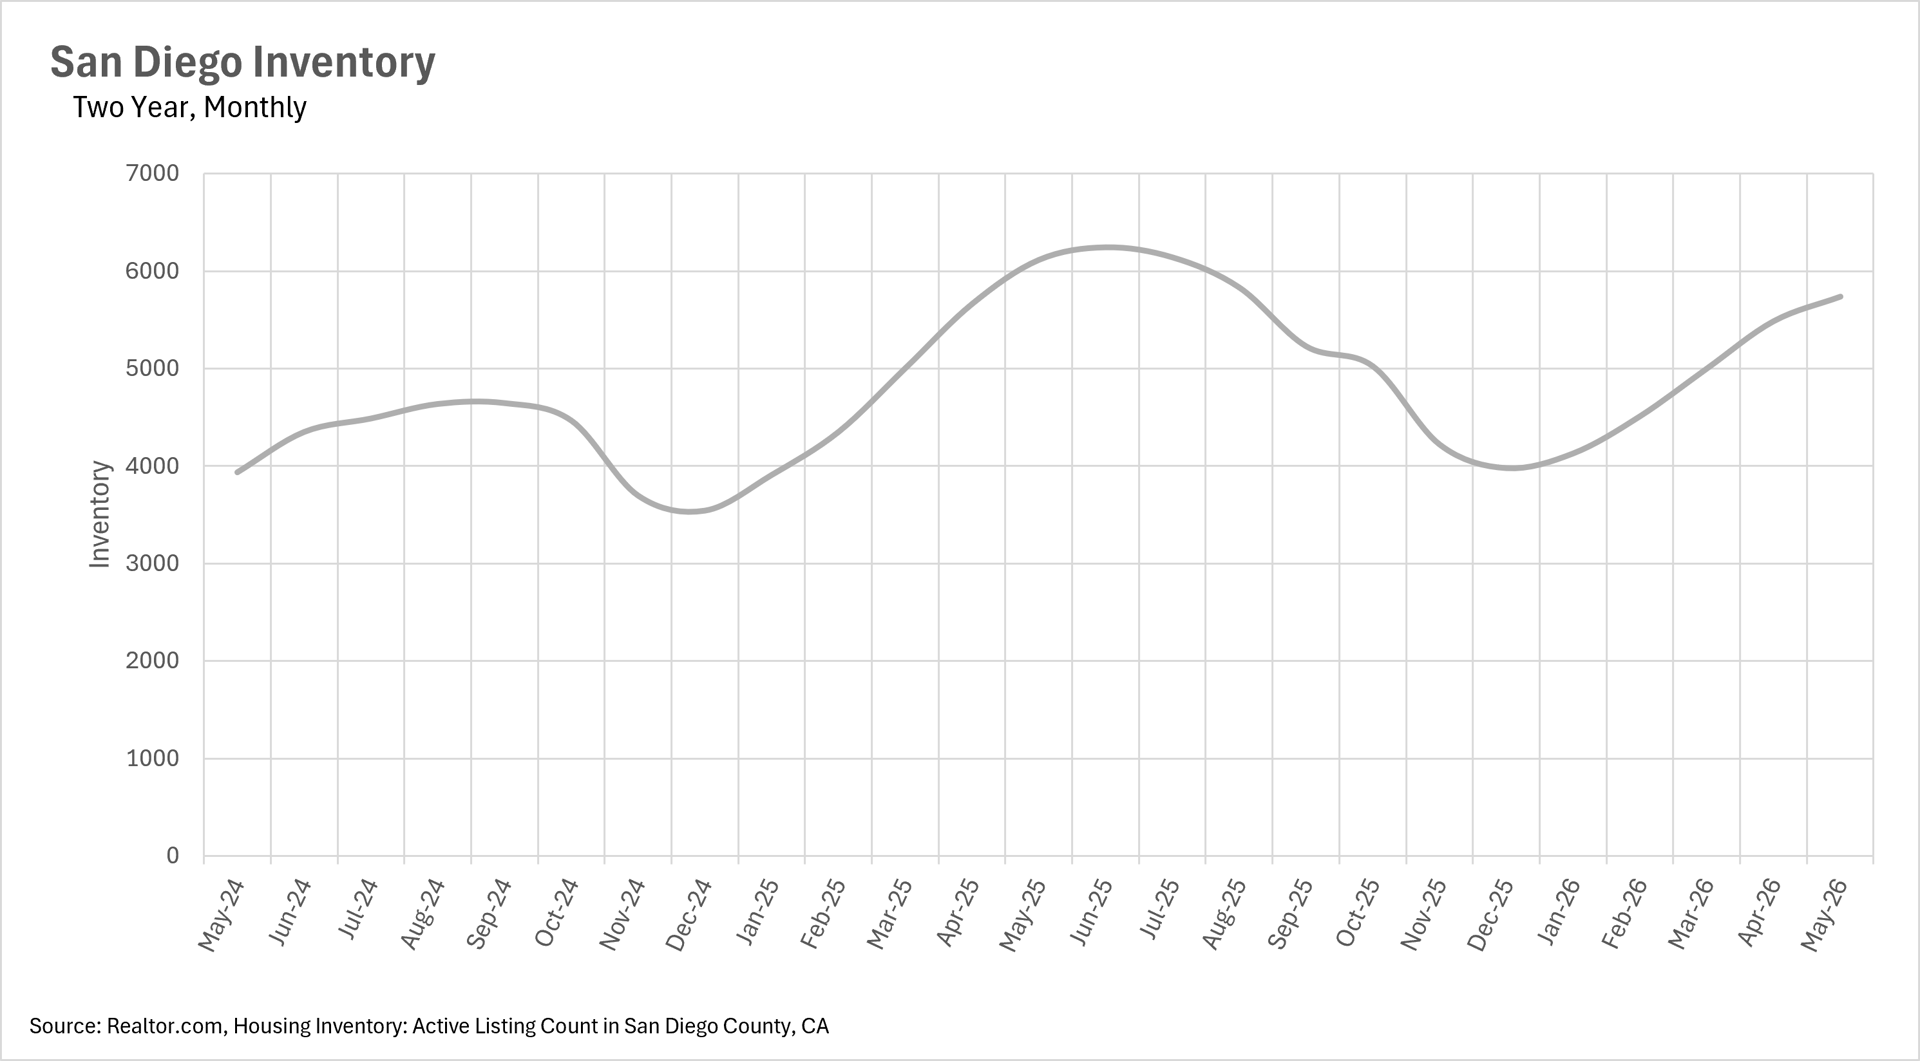
The inventory surplus is officially behind us. Throughout much of 2025, San Diego was dealing with elevated inventory levels compared to the prior year. That has changed. In May, there were 5,739 active single-family listings on the market — a 6.16% decrease year-over-year, the second consecutive month of year-over-year inventory declines. The excess supply from 2025 has been absorbed, and the market is tightening.
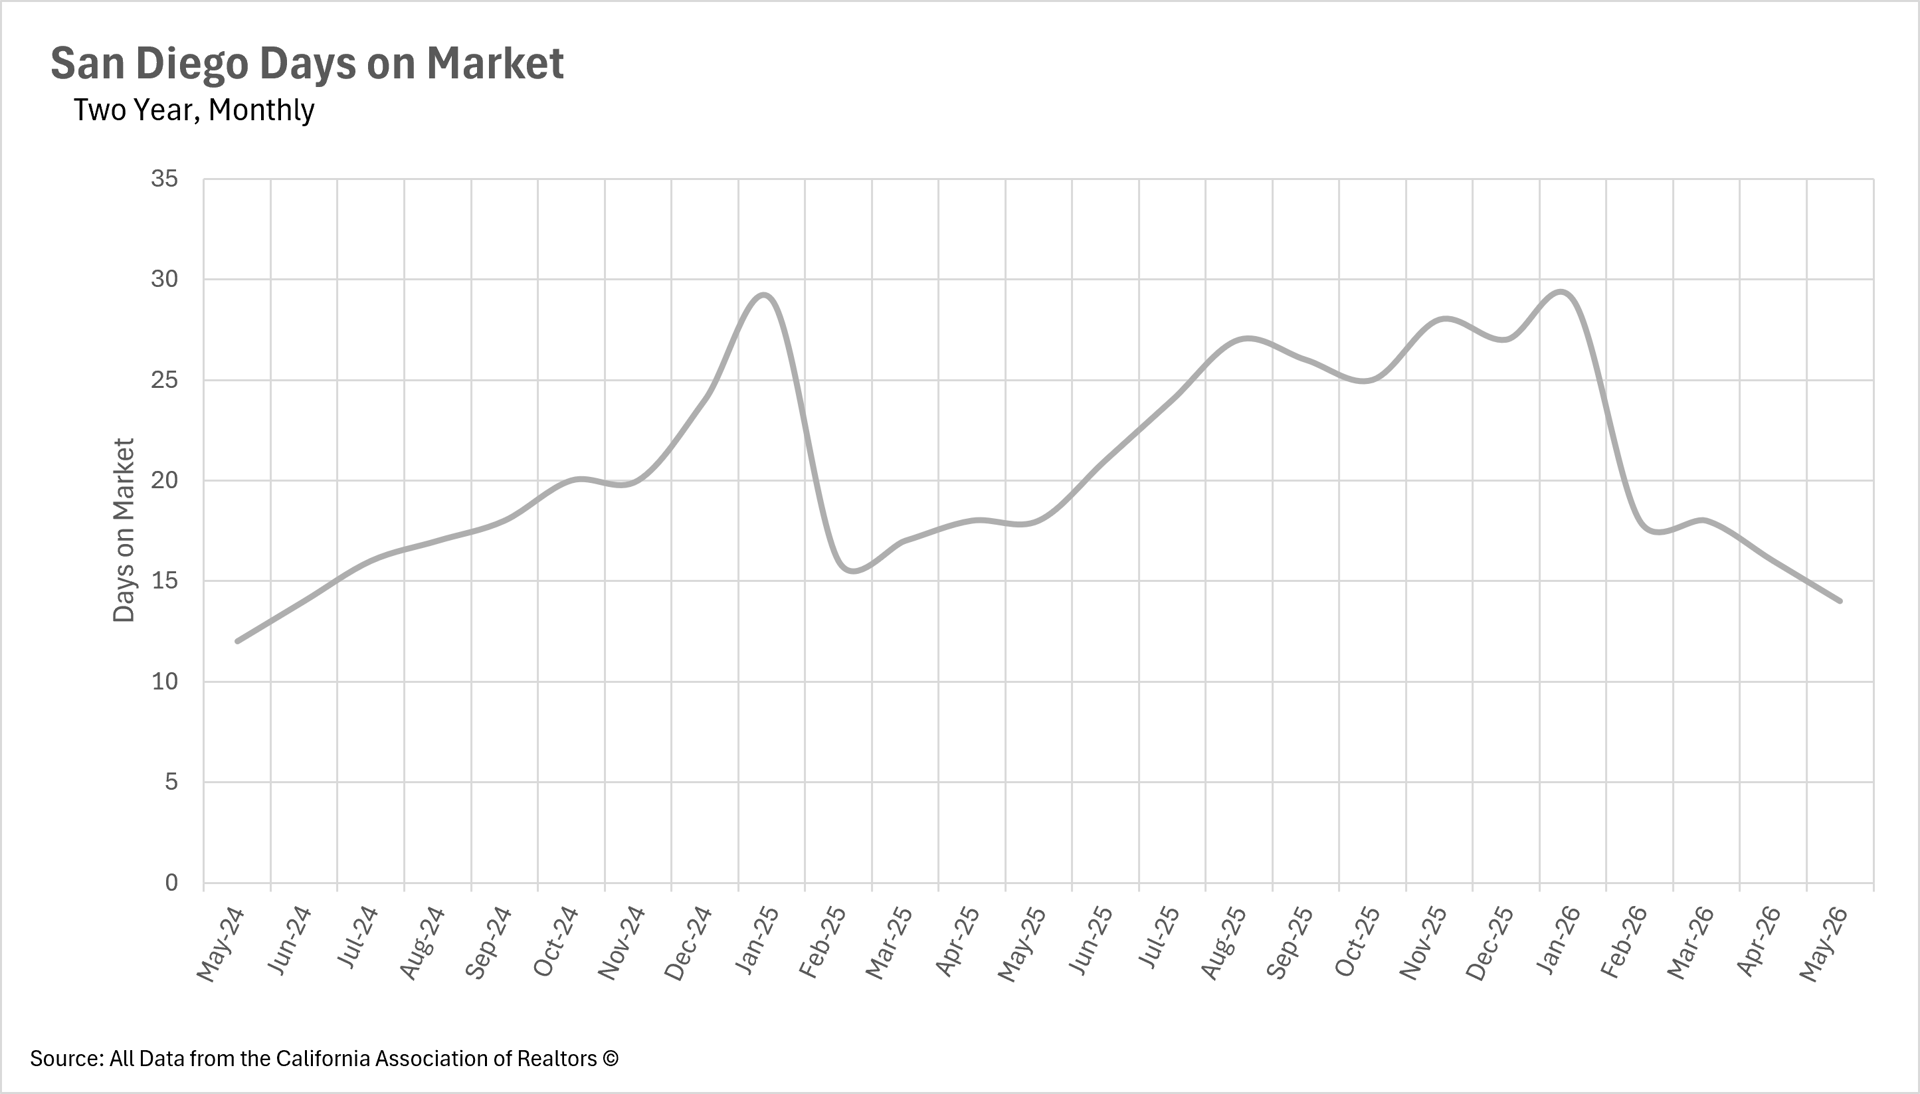
Homes are selling faster than they have in years. In May, the median single-family home in San Diego sold in just 14 days — a 22.22% decrease year-over-year. To put that in perspective: a year ago, the median listing sat for 18 days. At the slowest point of this cycle in January 2026, it was 29 days. The acceleration over the past few months has been significant, and it reflects buyers moving decisively when they find a property they want.
Where Does the Market Stand? Right at the Line.
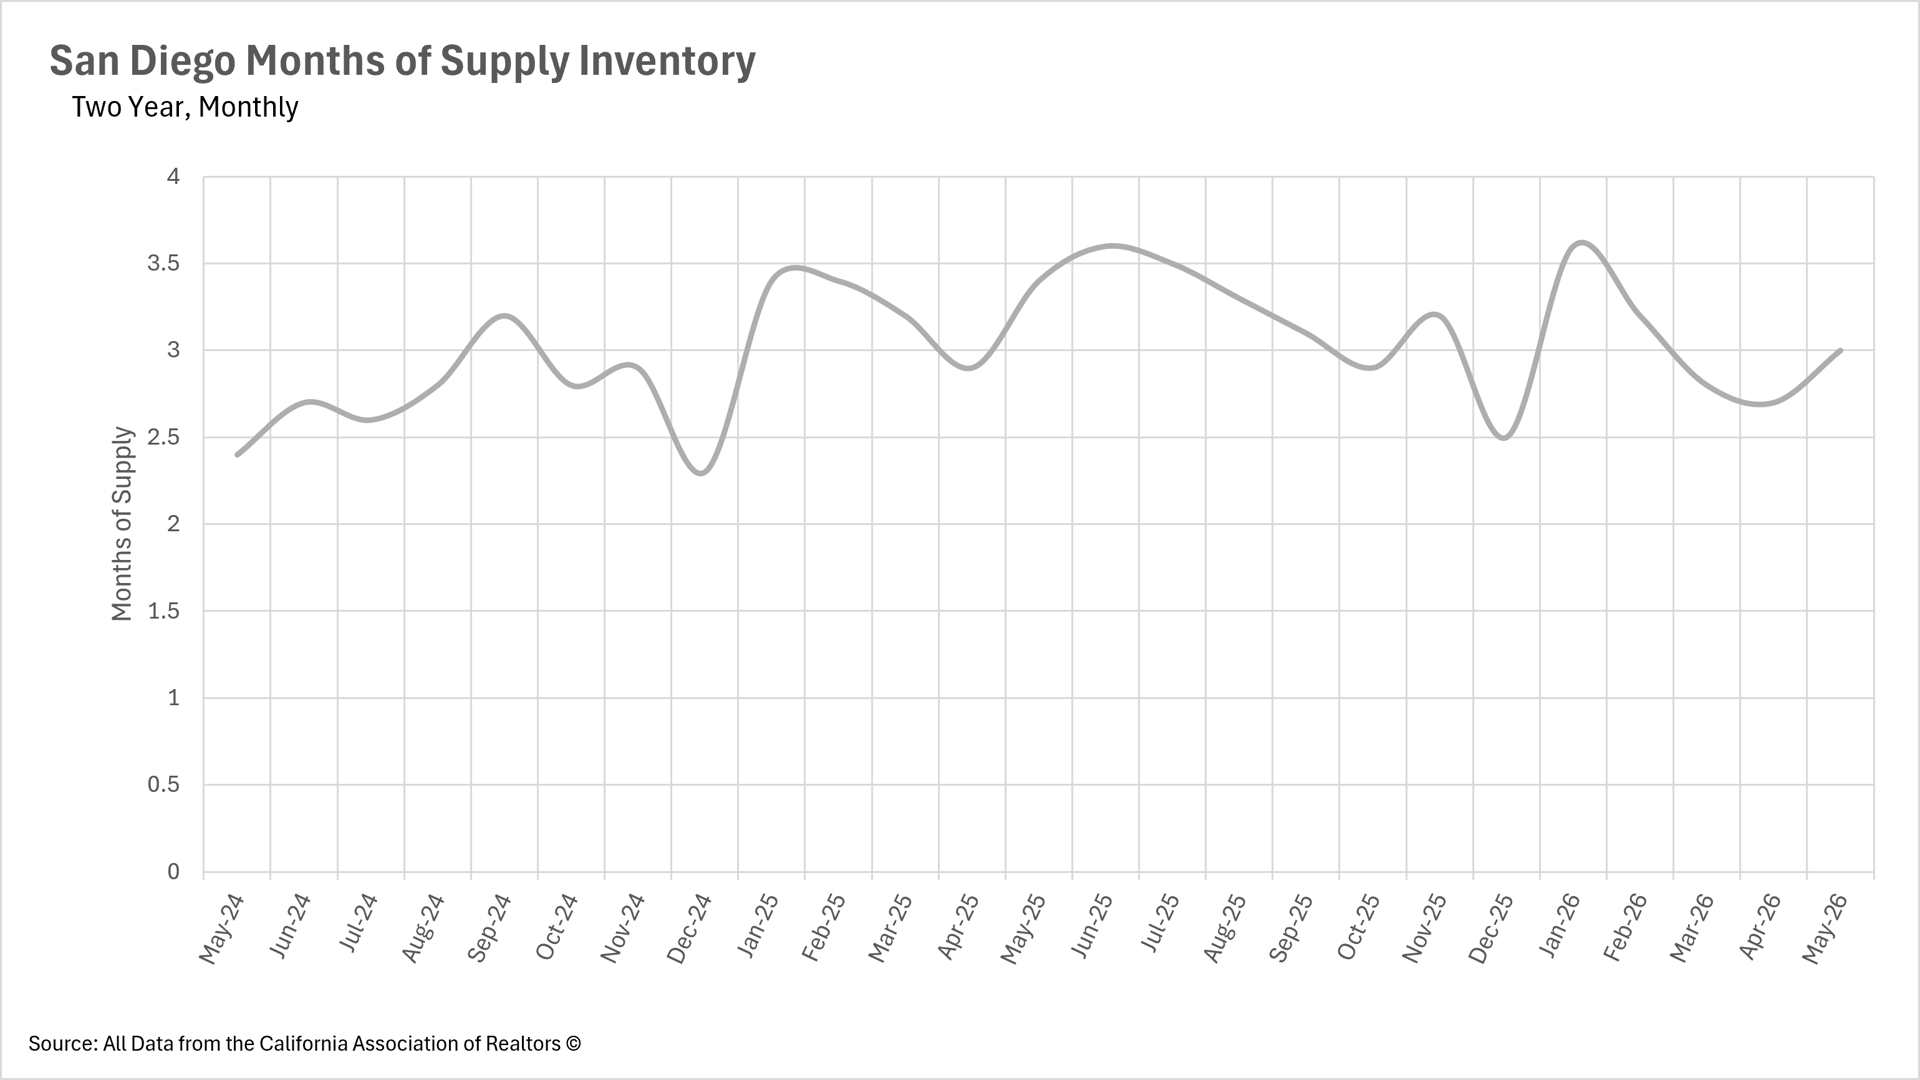
As of May, San Diego has exactly 3.0 months of supply on the market — placing it right at the threshold between a balanced market and a seller's market. That figure is still 11.76% lower than it was at this time last year, when there were 3.4 months of supply. Given how quickly listings are moving and the continued tightening of inventory, there is a reasonable likelihood that San Diego tips back into seller's market territory in the months ahead.
What This Means for You
For buyers, the takeaway is straightforward: the window of relative breathing room that existed earlier this year is narrowing. Listings are selling in two weeks. Inventory is declining. Monthly payments are rising. Coming prepared — with a strong pre-approval, a clear sense of priorities, and an agent who knows the contracts — is no longer optional in this market.
For sellers, conditions are increasingly favorable. Demand is absorbing available supply, days on market are at multi-year lows, and prices have held firmly above the million-dollar mark for eight consecutive months. The preparation you put into your listing — pricing, staging, presentation — still matters, but the market is moving in your direction.
Stay Informed Every Month
This data comes from our monthly market newsletter, which breaks down national and San Diego-specific trends with the charts and context you need to make informed decisions. If you found this useful, you can subscribe below to receive it directly in your inbox each month — no sales pitch, just the numbers and what they mean.
https://keyconnectionsrealty.com/
The information provided in this blog is for general informational purposes only and is not intended as tax, legal, or financial advice. Market data referenced reflects conditions as of July 2026 and is subject to change. Readers should consult their own advisor for guidance specific to their circumstances.